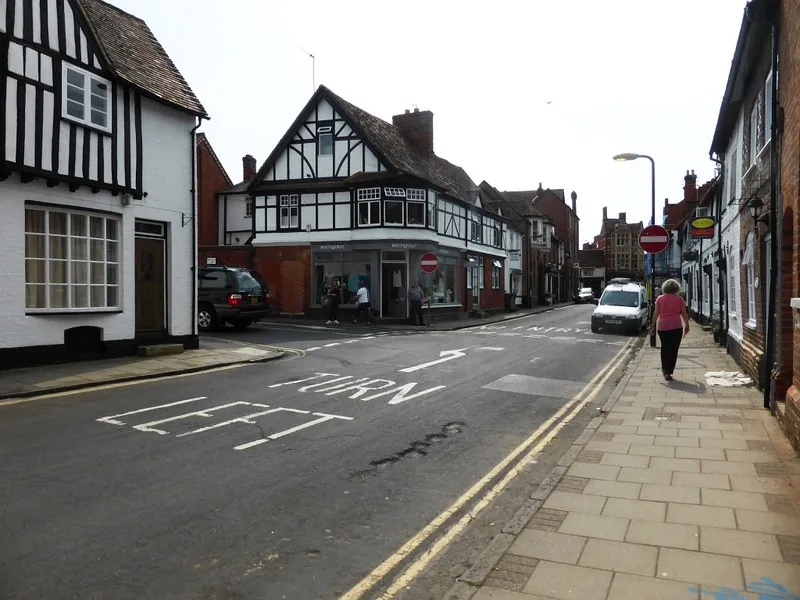

The middle Henley home sold for £600,000 in the year to June 2026 and the middle Didcot home for £350,000, in the same district. Prices by town, type and street.
The average home in South Oxfordshire sold for £474,283 in June 2026, and almost nobody in the district paid that. Take the completed sales HM Land Registry has recorded over the last twelve months and the middle Henley-on-Thames house cost £600,000, while the middle Didcot house cost £350,000. Same council, same council tax leaflet, a quarter of a million pounds apart.
Two different official figures are used below and they answer different questions. The £474,283 is the UK House Price Index for the whole district, a modelled monthly average that is good for tracking the direction of the market. The town numbers are medians of actual completed sales pulled from the Land Registry Price Paid record for the twelve months to 30 June 2026, filtered to the postcode sectors that make up each town. The median is the price of the middle sale, so one £8.6 million riverside farm cannot drag it anywhere.
What each town actually paid
| Town | Median sale | Sales counted | Postcodes used |
|---|---|---|---|
| Henley-on-Thames | £600,000 | 177 | RG9 1, RG9 2 |
| Wallingford | £430,000 | 90 | OX10 0 |
| Thame | £427,500 | 144 | OX9 3 |
| Didcot | £350,000 | 388 | OX11 6, 7, 8 |
Didcot is the district’s largest town and it is also its cheapest, by a distance. It supplied 388 of the 799 sales counted here, so it does more than any other place to hold the district average down, while Henley does the most to pull it up. If you have ever wondered why a South Oxfordshire figure quoted on the news felt wrong for your street, that is why: the district contains a Chilterns river town and a railway new town, and the average sits in the gap between them where almost no houses are.
Go outside the town boundary and Henley gets dearer still. Across the whole Henley-on-Thames postal area, which takes in Nettlebed, Stoke Row, Shiplake and the Chilterns villages, the median of 276 sales was £700,000. The town itself is the affordable part of its own postcode.
Henley by property type
| Property type | Median | Sales |
|---|---|---|
| Detached | £1,083,271 | 36 |
| Semi-detached | £635,000 | 39 |
| Terraced | £564,250 | 66 |
| Flat or maisonette | £387,500 | 36 |
The number that stands out is the terrace. Sixty-six of the 177 sales in the town were terraced houses, more than any other type, and the middle one went for £564,250. In Didcot the middle terrace was £300,000. Buying the most common sort of house in Henley costs almost twice what the same description costs at the other end of the same district.
At the top, a detached house in the town crossed £1 million at the median. The dearest ordinary house sale recorded in the town postcodes over the year was 3 Rotherfield Road at £2,450,000 in July 2025. The cheapest was a flat at 23 War Memorial Place at £140,000 in June 2026.
Streets, where there were enough sales to say
Individual streets need a health warning: four or five sales is a small sample, and one unusual house moves the figure. These are the Henley town streets with at least four completed sales in the twelve months.
| Street | Median sale | Sales |
|---|---|---|
| St Marks Road | £1,340,000 | 6 |
| Vicarage Road | £862,500 | 4 |
| Elizabeth Road | £762,500 | 4 |
| Reading Road | £628,000 | 8 |
| Greys Road | £609,500 | 8 |
| Milton Close | £560,000 | 4 |
| Park Road | £523,750 | 8 |
| Harpsden Road | £488,500 | 5 |
| Crisp Road | £386,000 | 4 |
| War Memorial Place | £165,000 | 6 |
St Marks Road and War Memorial Place are both in the RG9 1 postcode sector and the gap between their medians is £1,175,000. That is Henley in one line. You can check any address yourself, free, on the HM Land Registry price paid search.
Which way the market is going
| Area | Average price | Change over 12 months |
|---|---|---|
| Windsor and Maidenhead | £576,992 | −2.2% |
| Wokingham | £498,941 | −3.1% |
| Buckinghamshire | £490,508 | +4.3% |
| South Oxfordshire | £474,283 | +5.2% |
| Oxford | £466,815 | −0.9% |
| Oxfordshire | £418,059 | +3.1% |
| West Oxfordshire | £416,425 | −1.5% |
| Vale of White Horse | £414,441 | +6.3% |
| West Berkshire | £402,790 | +0.2% |
| South East | £380,380 | +0.3% |
| Reading | £361,243 | +0.9% |
| Cherwell | £353,632 | +3.8% |
| England | £293,262 | +1.8% |
South Oxfordshire rose 5.2% over the year to June 2026, second only to Vale of White Horse in the county and far ahead of the South East’s 0.3%. It has now overtaken Oxford, which fell 0.9% over the same year, so the district is £7,468 dearer than the city. That is the first time it has been ahead since December 2021. On the Land Registry’s index, where 2023 is set at 100, South Oxfordshire reads 103.6 and the South East reads 98.1: this district has got back past its 2023 level and the region as a whole has not.
The month of June itself was up 0.9%, so the rise is not purely a base effect. The index runs two to three months behind and is revised as more sales complete, which is why the May figure on this page moved from £470,720 to £470,215 when the June data landed. See our full write-up of the June release for the district ranked against all 295 in England.
Buyers, sellers and the step up
The same data splits by buyer. A first-time buyer in South Oxfordshire paid an average of £382,013 in June 2026. Somebody selling one home here to buy another paid £559,858. That step of £177,845 is the district’s real affordability problem in one number, and in Henley it is bigger still: the gap between the town’s median flat at £387,500 and its median semi at £635,000 is £247,500.
If you are buying in Henley, the cheapest route into the town is a flat or a terrace in the RG9 1 and RG9 2 postcodes rather than anything in the villages, where the median is a hundred thousand pounds higher. Check what is proposed near the address on our Henley planning page, because the district cannot currently demonstrate a five-year housing land supply, which makes speculative applications more likely to succeed.
If you are buying in the district but not in Henley, Didcot is £250,000 cheaper at the median and has the fastest trains to Paddington of anywhere in South Oxfordshire, 37 minutes against Henley’s 45 with a change.
If you are selling, you are selling into the strongest twelve months any Oxfordshire district has had, but not into a rising month.
Frequently asked questions
What is the average house price in Henley-on-Thames?
The middle completed sale in the Henley town postcodes RG9 1 and RG9 2 was £600,000 over the twelve months to 30 June 2026, from 177 recorded sales (HM Land Registry Price Paid). Across the wider Henley-on-Thames postal area, including the Chilterns villages, the median was £700,000.
What is the average house price in South Oxfordshire?
£474,283 in June 2026, on the UK House Price Index, up 5.2% over the year. That covers the whole district, from Henley to Didcot, so it is higher than what most Didcot buyers pay and much lower than what most Henley buyers pay.
Are house prices in South Oxfordshire rising or falling?
Rising, and second-fastest in the county. Prices were up 5.2% in the year to June 2026, against 3.1% for Oxfordshire, 0.3% for the South East and a fall of 2.4% in neighbouring West Oxfordshire. The month of May on its own was down 0.2%.
How much cheaper is Didcot than Henley?
At the median, £250,000. The middle Didcot sale was £350,000 and the middle Henley town sale was £600,000 over the same twelve months. On terraced houses specifically the gap is £264,250, with Didcot at £300,000 and Henley at £564,250.
How much is a house rather than a flat in Henley?
In the town postcodes over the last twelve months, the median terraced house sold for £564,250, the median semi-detached for £635,000 and the median detached house for £1,083,271. A flat or maisonette sold for £387,500.
Where can I check what a specific Henley house sold for?
Every completed sale in England and Wales is public. Search an address or a street free on the HM Land Registry price paid service.
Sources
- UK House Price Index, South Oxfordshire (ONS / HM Land Registry) for the district average, property-type and buyer-type figures and the annual and monthly changes.
- Land Registry UK HPI open data, South Oxfordshire, June 2026 and the matching records for Oxford, Cherwell, Vale of White Horse, West Oxfordshire, Oxfordshire, Wokingham, Reading, West Berkshire, Buckinghamshire, Windsor and Maidenhead, the South East and England for the comparison table.
- HM Land Registry Price Paid linked data for the town, property-type and street medians, being every completed sale recorded with a Henley-on-Thames, Wallingford, Thame or Didcot postal address between 1 July 2025 and 30 June 2026, filtered to the postcode sectors listed in the table.
- HM Land Registry price paid search to check any individual address.
Land Registry figures are provisional and are revised as more sales complete; the index runs two to three months behind. Confirm the latest numbers against the linked sources before making a decision. What is being built near you is on Henley planning; what the commute costs is on Henley trains to London.
Have your say